Predictive Validity
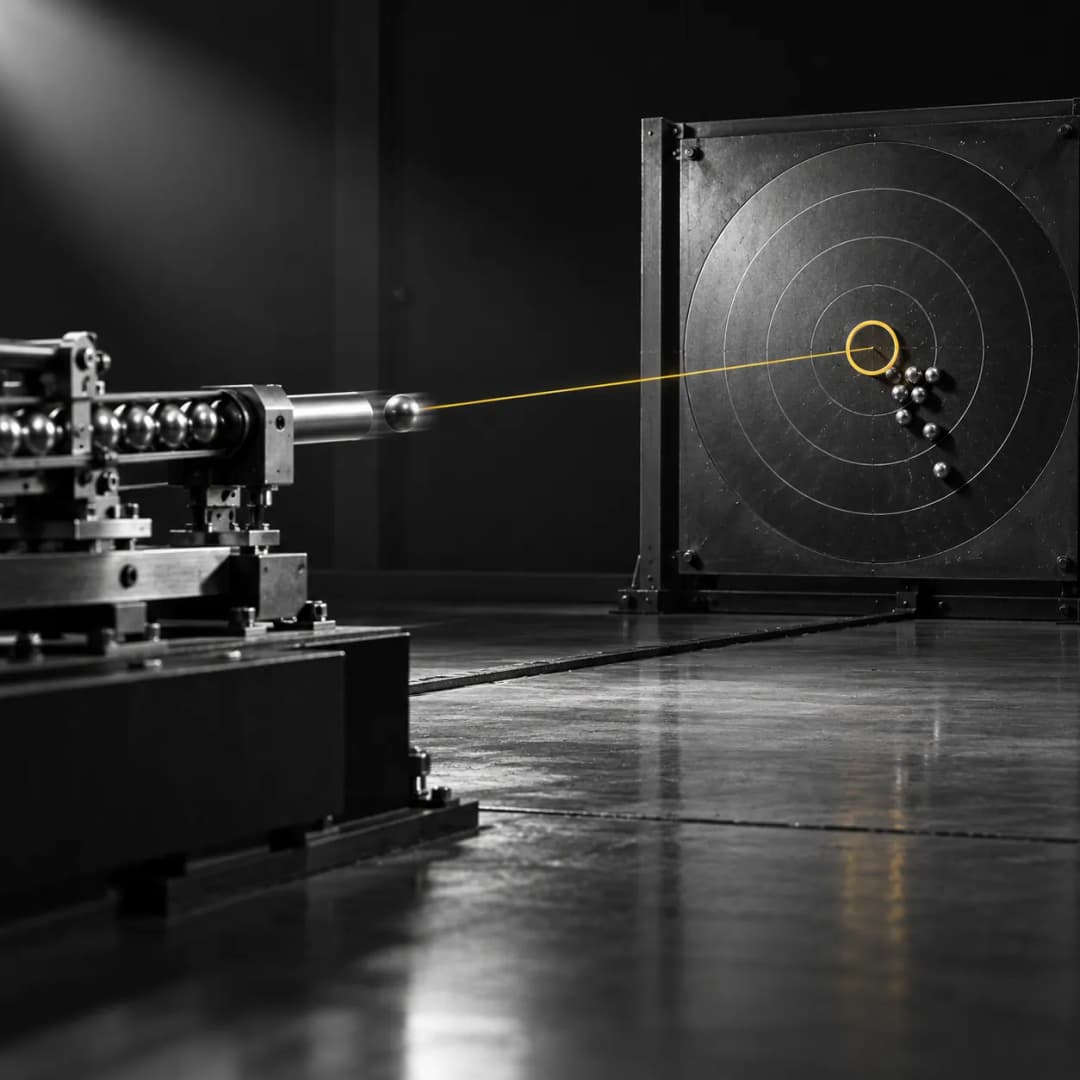
Predictive validity is how well a score forecasts an outcome it is supposed to relate to. It is usually reported as a correlation between the score and the outcome, recorded separately. For the Implicit Association Test the outcome is discriminatory behaviour, and two pooled analyses of the studies put the correlation at about 0.24 and about 0.15, a gap that depends mainly on which studies each analysis counted.
What it is
A measurement can be consistent and still not mean what its name says. A bathroom scale that always reads two kilograms heavy is consistent, and its readings still need correcting before they say anything about weight. Predictive validity is one of the checks on meaning. If a score is offered as a measure of some property of a person, then the score should relate to things that property would be expected to affect, and the strength of that relationship can be counted.
The usual statistic is a correlation between the score and a criterion, a behaviour or outcome recorded on its own. A correlation of zero means the score tells you nothing about the criterion. A correlation of one means the score fixes it exactly. Real instruments sit between the two, and how much is enough depends on what the score is being used for. A figure that is useful for describing a large group can be useless for deciding about one person, and that distinction runs through the whole of the Implicit Association Test dispute.
Predictive validity sits beside two neighbouring ideas. Construct Validity asks whether an instrument measures the thing its name claims, which is a broader question than prediction. Test-Retest Reliability asks whether a person's score holds steady from one occasion to the next, which limits how well any score can predict anything.
In effect
The Implicit Association Test returns a difference in milliseconds between two ways of sorting words. Reading that difference as a hidden bias is an interpretation, and the criterion studies are where the interpretation is tested against behaviour.
Two meta-analyses of those studies disagree. Greenwald and colleagues pooled studies in 2009 and found that, for racially discriminatory behaviour, the race version of the test correlated with the criterion at about 0.24, against about 0.12 for self-report. Frederick Oswald and colleagues worked from a broader set of studies in 2013, found about 0.15 for the same category, and described the test as a poor predictor of who will discriminate against whom.
Greenwald, Mahzarin Banaji and Brian Nosek went back to the gap in 2015 and traced most of it to inclusion rules. The 2009 analysis counted only correlations with a theoretical reason to expect a relationship, and the 2013 analysis included many without one. Neither analysis disputes that the numbers are small. The 2015 paper argues that correlations of that size can still produce socially significant discrimination, either by touching many people at once or by touching the same person repeatedly. Its worked illustration is that a difference small enough to yield a correlation near 0.08 can disadvantage a meaningful share of a protected group after ten to twenty-five repetitions, as in successive applications, evaluations or appointments.
The same number is therefore read two ways. As a forecast about one person it is weak. As a description of what an aggregate of encounters might do it can still matter. Predictive validity as a concept does not choose between those readings, which is why the dispute continues.
What it does not say
A correlation across studies describes how scores and behaviour move together across many people. It does not say what any single person will do. The authors of the 2015 paper defending the test say as much: the modest test-retest reliability and small effects make it risky for classifying individuals, though those limits matter less for analyses of whole systems.
It does not establish cause. A score that correlates with a behaviour has not been shown to produce it, and a 2019 pooled analysis of 492 studies found that changes in implicit measures did not mediate changes in explicit measures or in behaviour.
It is not a single fixed number for an instrument. The two meta-analyses above counted different sets of studies and so reached different totals for the same test. A figure quoted without the rule that selected the studies behind it is incomplete.
It is also specific to a version of an instrument and an outcome. The race version predicting discriminatory behaviour is the case these analyses cover. They do not cover a version built around other categories, such as creativity against practicality, and say nothing directly about one.
Sources
- Greenwald, A. G., Poehlman, T. A., Uhlmann, E. L., & Banaji, M. R. (2009). Understanding and using the Implicit Association Test: III. Meta-analysis of predictive validity. Journal of Personality and Social Psychology, 97(1), 17-41.
- Oswald, F. L., Mitchell, G., Blanton, H., Jaccard, J., & Tetlock, P. E. (2013). Predicting ethnic and racial discrimination: A meta-analysis of IAT criterion studies. Journal of Personality and Social Psychology, 105(2), 171-192.
- Greenwald, A. G., Banaji, M. R., & Nosek, B. A. (2015). Statistically small effects of the Implicit Association Test can have societally large effects. Journal of Personality and Social Psychology, 108(4), 553-561. doi:10.1037/pspa0000016
- Forscher, P. S., Lai, C. K., Axt, J. R., Ebersole, C. R., Herman, M., Devine, P. G., & Nosek, B. A. (2019). A meta-analysis of procedures to change implicit measures. Journal of Personality and Social Psychology, 117(3), 522-559. doi:10.1037/pspa0000160